Diversity City
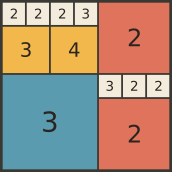
Every zone counts the different sizes next door, and the city scores their average — so the fewer, busier zones win.
Play Diversity City Share or embed
- Grades
- 3–6
- Subjects
- Multiplying & Dividing, Shapes & Space
- Kind
- Puzzle
- Cost
- Free, no account, no ads
- Original
- Diversity City at MathPickle
What it is
The city is a square grid, and it is cut into square zones: drag out a square and it is built, tap it and it falls back into single lots. Every zone wears a number, which is how many different sizes of zone share an edge with it — a zone touching two 1 × 1s and a 3 × 3 scores 2, not 3. The city scores the average of all those numbers, and each city has three averages to reach, one after another. Done works the score out in front of you: the points climb, the zones climb, and then one is divided by the other.
The rules
Cut the city into square zones so that every zone has neighbours of many different sizes.
What it gives you to practise
Averages, and what moves one. Every zone counts once on each side of the division, so a zone scoring below the city’s average pulls it down unless it lifts its neighbours by more, and a city of fewer, busier zones beats one cut into many small ones. The colours do the counting of sizes, since every size has its own, and holding a zone down lights just the zones it touches. The score stays hidden until Done is pressed, so each city is a guess about an average checked by working it out.
In a classroom
Gordon Hamilton, MathPickle, 2020. His 7 × 7 city in the video scores 30 ÷ 12 = 2.5, which he called pretty good; here every 7 × 7 goal is above it. The cities run from 4 × 4 to 12 × 12. Up to 8 × 8 the best possible city has been found by checking every one of them by computer; from 9 × 9 up, the goals sit under the best city a computer search has found, and a class may beat it. Every city that is scored stays on a wall beside the board, so the climb is there to talk about afterwards. The board prints as an empty grid, for graph paper and a pencil.
Share or embed
Near it on the shelf
- Fractured FractionsOne point cuts the whole picture at once, and every piece has to come out holding the fraction written on it.
- GalaxeaTwo of the three dice are the sides of a rectangle — and the game is which two, and where to hang it.
- Mondrian PuzzleEvery rectangle painted is a multiplication, and the score is the gap between the biggest one and the smallest.